For this case study, we have generated data through software as we cannot use real data of our clients
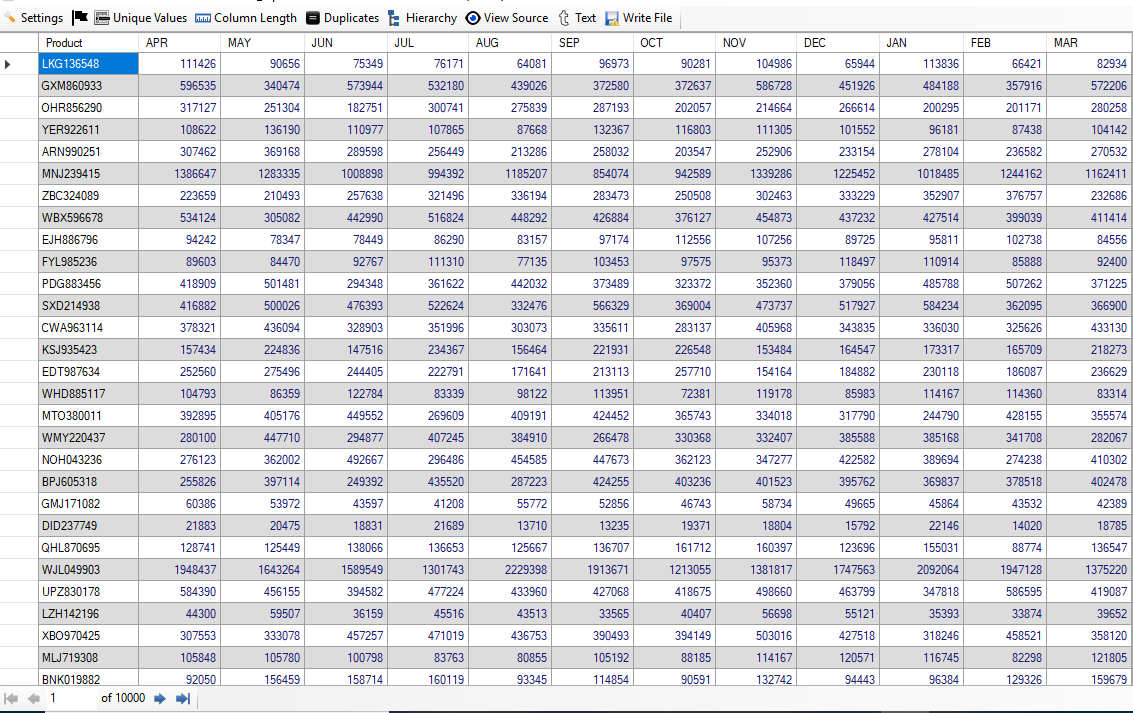
The dataset contains sales data for 12 months. It has 13 columns. The details of these columns are given below:
(1) Product: Product ID
(2) APR: Sales Amount for the month of April
(3) MAY: Sales Amount for the month of May
(4) JUN: Sales Amount for the month of June
(5) JUL: Sales Amount for the month of July
(6) AUG: Sales Amount for the month of August
(7) SEP: Sales Amount for the month of September
(8) OCT: Sales Amount for the month of October
(9) NOV: Sales Amount for the month of November
(10) DEC: Sales Amount for the month of December
(11) JAN: Sales Amount for the month of January
(12) FEB: Sales Amount for the month of February
(13) MAR: Sales Amount for the month of March
The sales data from April to March (for one year) is given as amount with Product ID. The data are given from April to March because in India financial year starts from April. In any case, we require data of last 12 months so that we can find products whose sales is high
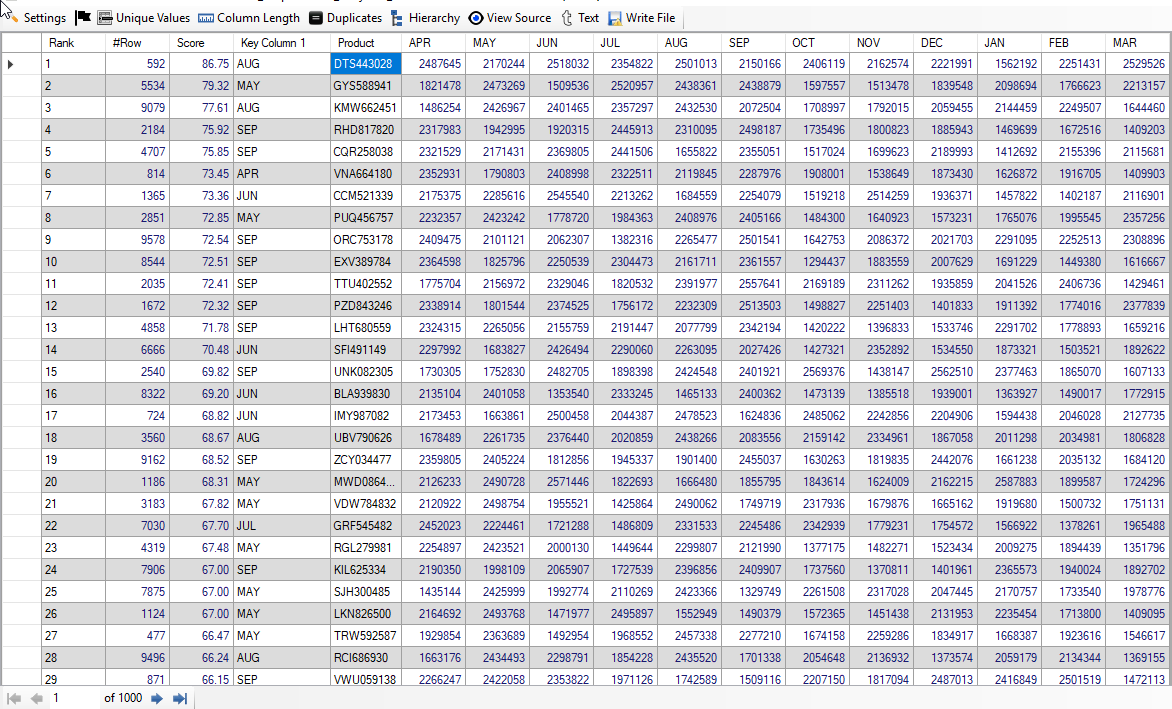
Below, we give screenshot of Sales Data:
The idea is to pick up the best performing products identified by 'Discover', and investigate the reasons / factors responsible for their exceptional performance. Once the factors are identified, the management can invest on these factors to further boost the sales of the products.
Result 1: Yearly Data Analysis of Best Products
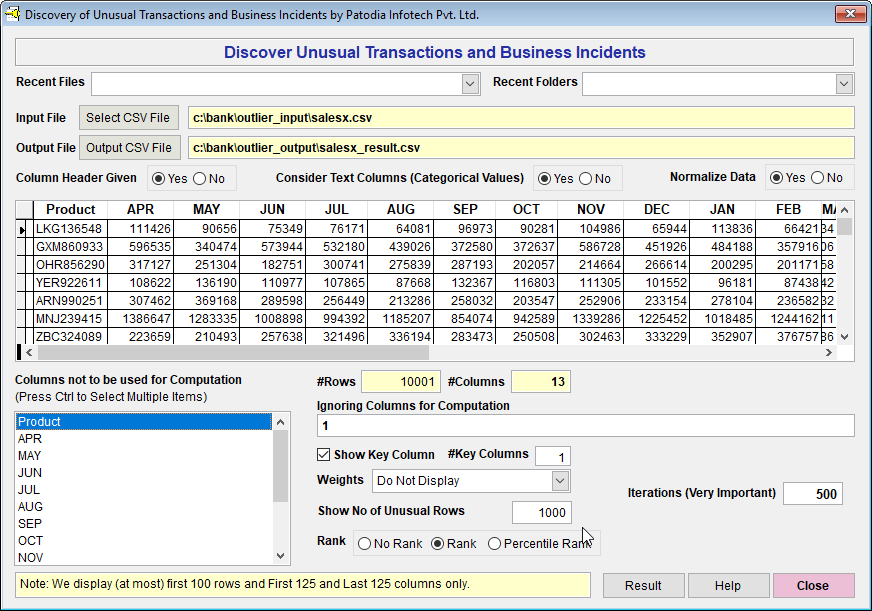
We have selected the dataset in "Discover" and asked to find out top 1000 products whose sales is very high. We have not selected Product ID as it is only for identification. Below, we give the screenshot of "Discover":
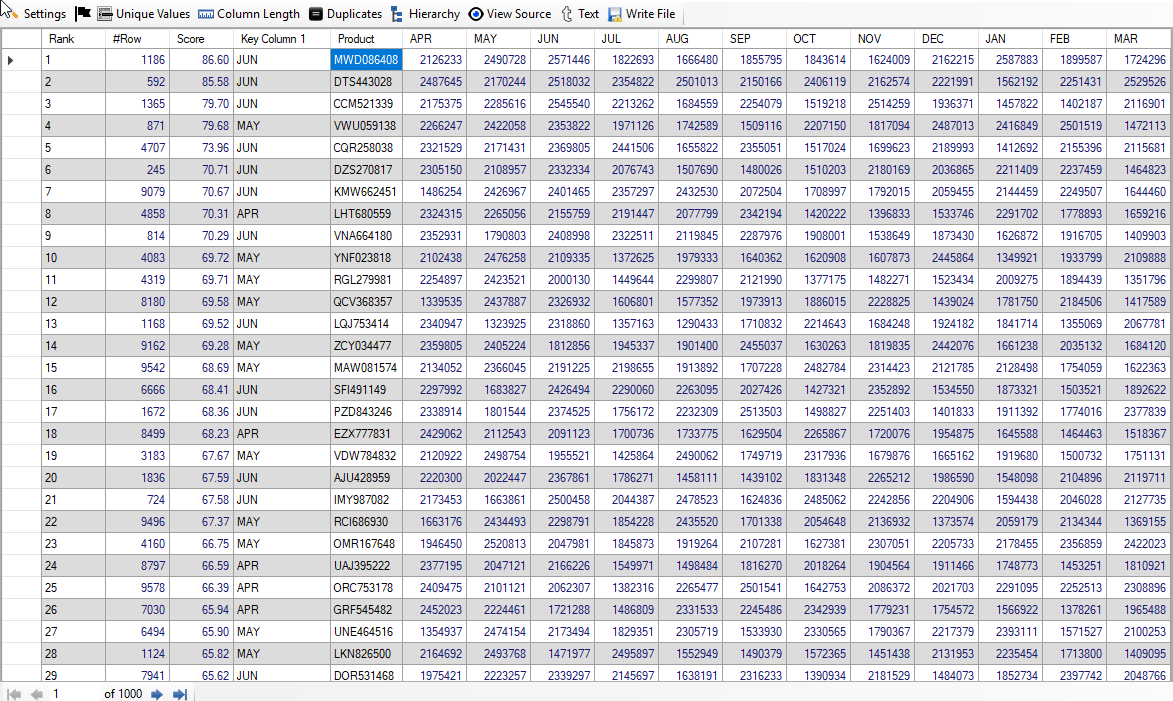
When we click on "Result" button, we see the following result (given screenshot of Result):
Analysis of Result
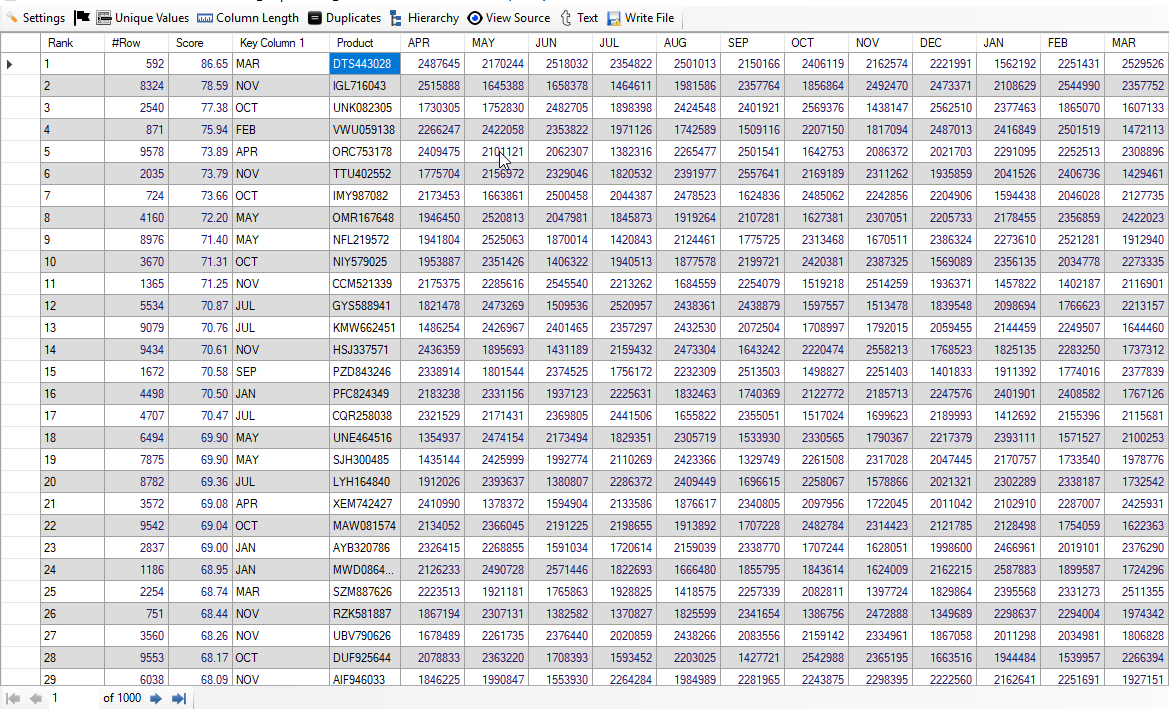
We find that top Product ID is "DTS443028". Its sale is higher than other products. The score is 86.65%. The Key Column 1 is MAR. The sale of March month is 2,529,526 that is higher than other months. However, the score is computed based on all the months.
Note: Please note that it took less than 5 seconds on a moderate hardware to find top 1,000 highest selling products from 10,000 products.
Result 2: First Quarter Best Products
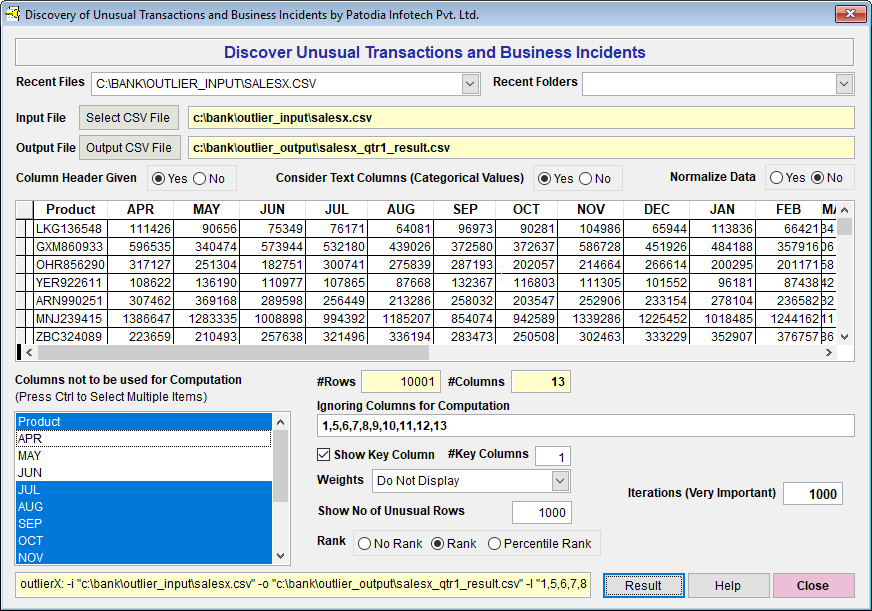
For this purpose, we have selected all columns except APR, MAY and JUN so that all other columns are ignored, and computation is done of these three months. This gives the best products result for First Quarter. Below, we give the screenshot of "Discover":
When we click on "Result" button, we see the following result (given screenshot of Result):
Analysis of Result
We find that top Product ID is "MWD086408". its sale is higher than other products in the first quarter. The score is 86.60%. The Key Column 1 is JUN. The sale of June month is 2,571,446 that is higher than other months of the first quarter. However, the score is computed based on all the months of the first quarter (Months of APR, MAY and JUN).
Result 3: Second Quarter Best Products
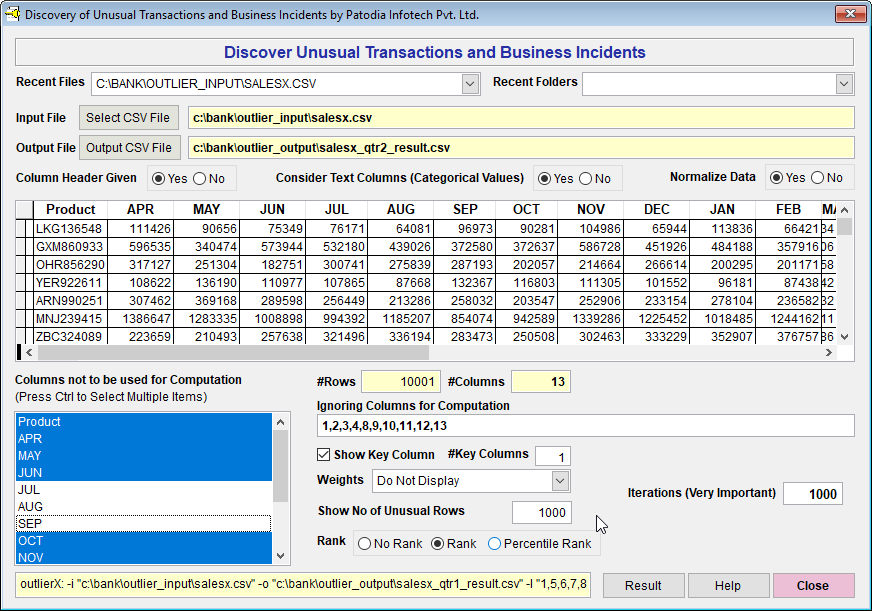
For this purpose, we have selected all columns except JUL, AUG and SEP so that all other columns are ignored, and computation is done of these three months. This gives the best products result for Second Quarter (for the months of July, August and September). Below, we give the screenshot of "Discover":
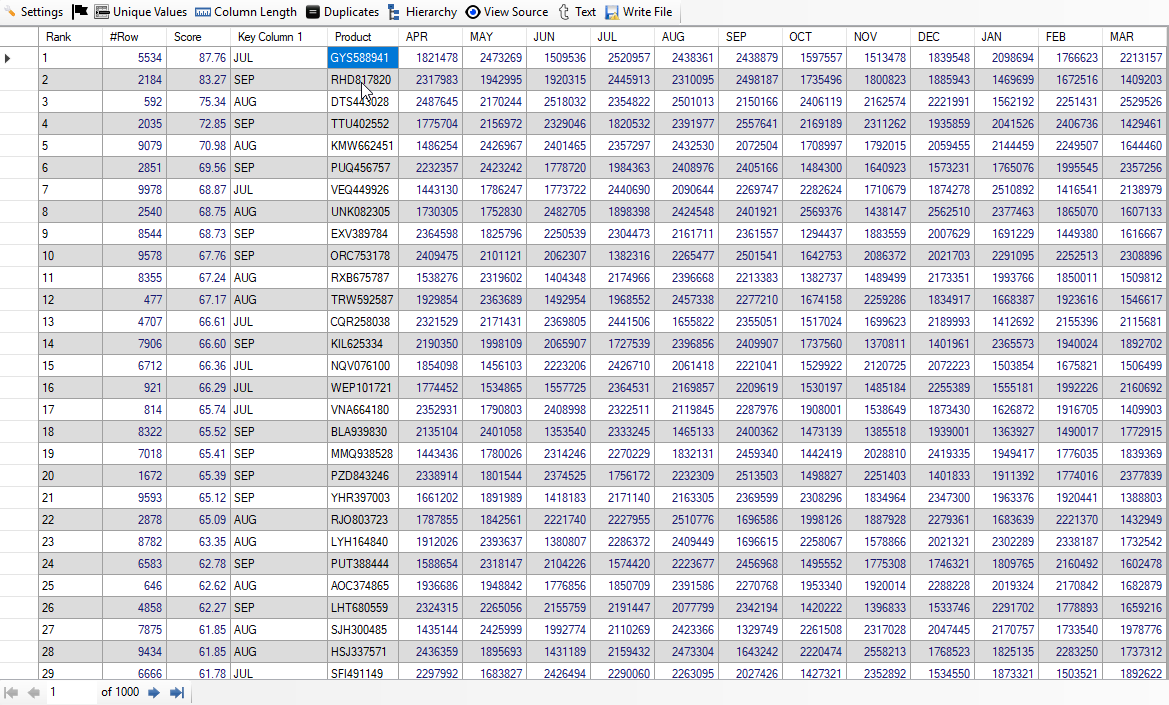
When we click on "Result" button, we see the following result (given screenshot of Result):
Analysis of Result
We find that top Product ID is "GYS588941". Its score is 87.76%. The Key Column 1 is JUL. The sale of July month is 2,520,957 that is higher than other months of the Second quarter. However, the score is computed based on all the months of the Second quarter (Months of July, August and September).
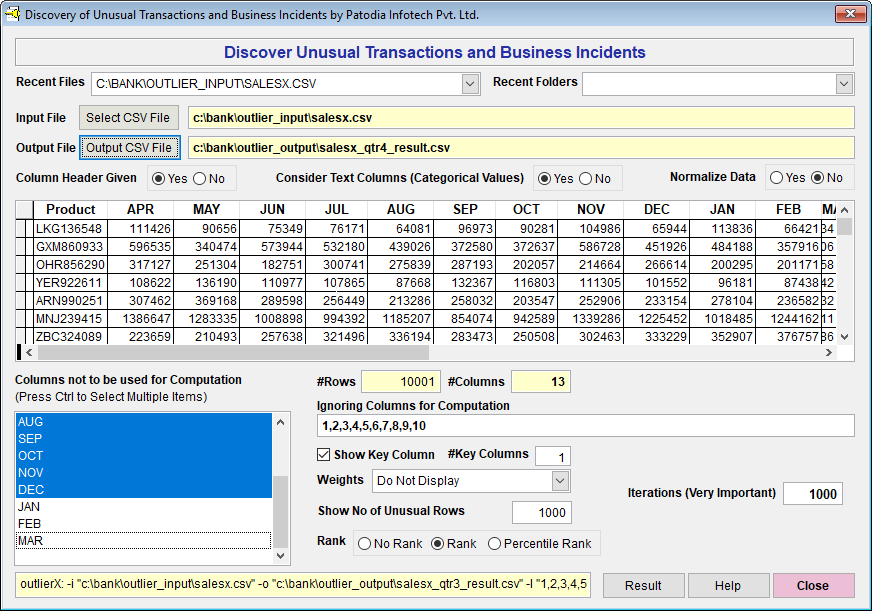
Result 4: Third Quarter Best Products
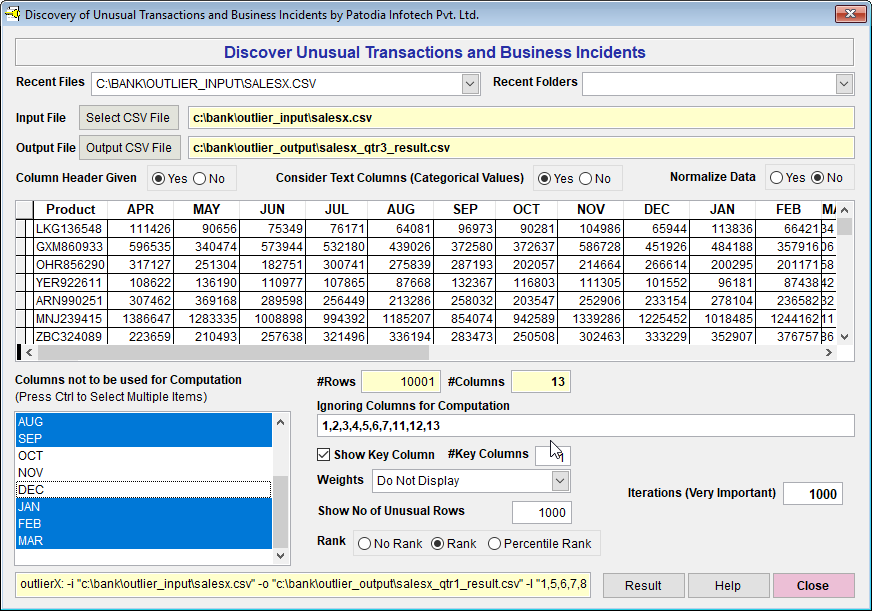
For this purpose, we have selected all columns except OCT, NOV and DEC so that all other columns are ignored, and computation is done of these three months. This gives the best products result for Third Quarter (for the months of October, November and December). Below, we give the screenshot of "Discover":
When we click on "Result" button, we see the following result (given screenshot of Result):
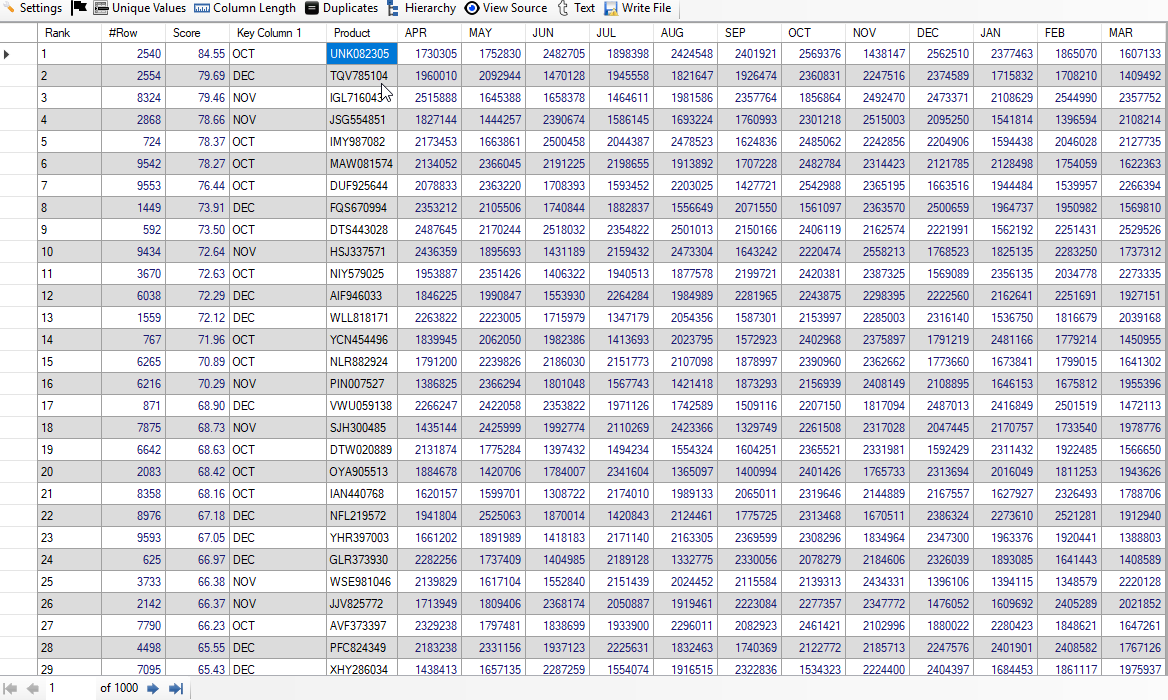
Analysis of Result
In the given screenshot, we can see the top 29 products though "Discover" has computed top 1,000 products. We find that top Product ID is "UNK082305". Its score is 84.55%. The Key Column 1 is OCT. The sale of October month is 2,569,376 that is higher than other months of the Third quarter. Of course, the score is computed based on all the months of the Third quarter (Months of October, November and December).
Result 5: Fourth Quarter Best Products
For this purpose, we have selected all columns except JAN, FEB and MAR so that all other columns are ignored, and computation is done of these three months. This gives the best products result for Fourth Quarter (for the months of January, February and March). Below, we give the screenshot of "Discover":
When we click on "Result" button, we see the following result (given screenshot of Result):
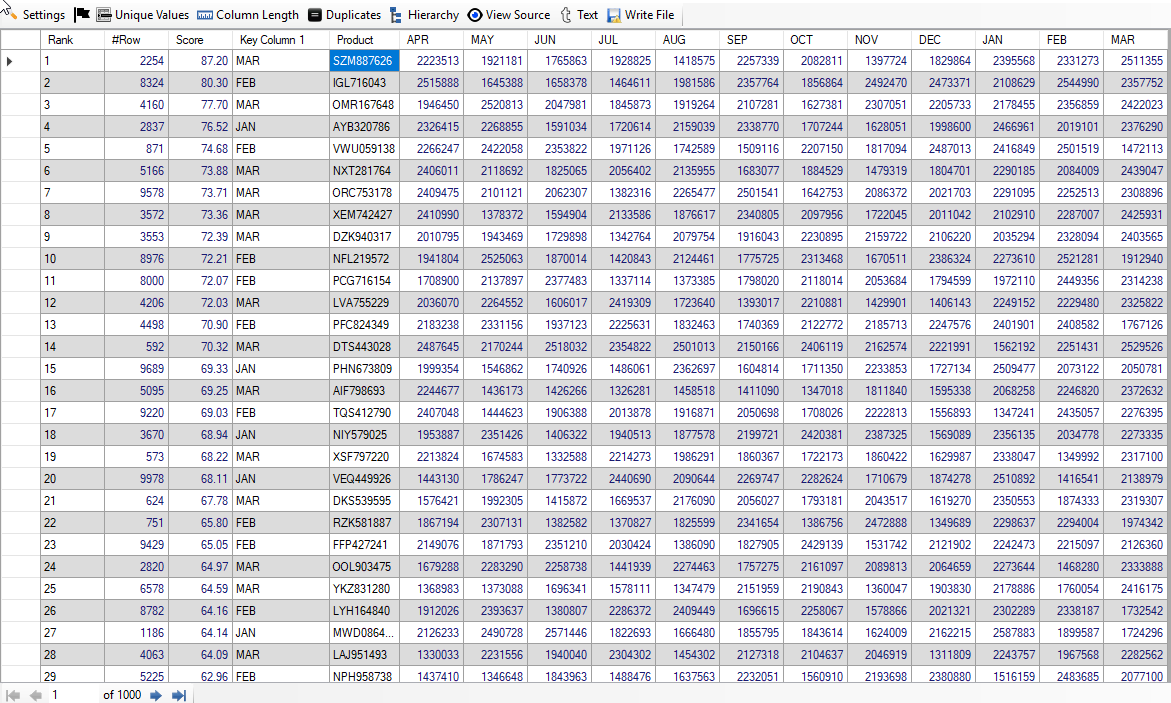
Analysis of Result
The top Product ID is "SZM887626". Its score is 87.20%. The Key Column 1 is MAR. The sale of March month is 2,511,355 that is higher than other months of the Fourth quarter. Of course, the score is computed based on all the months of the Fourth quarter (Months of January, February and March).
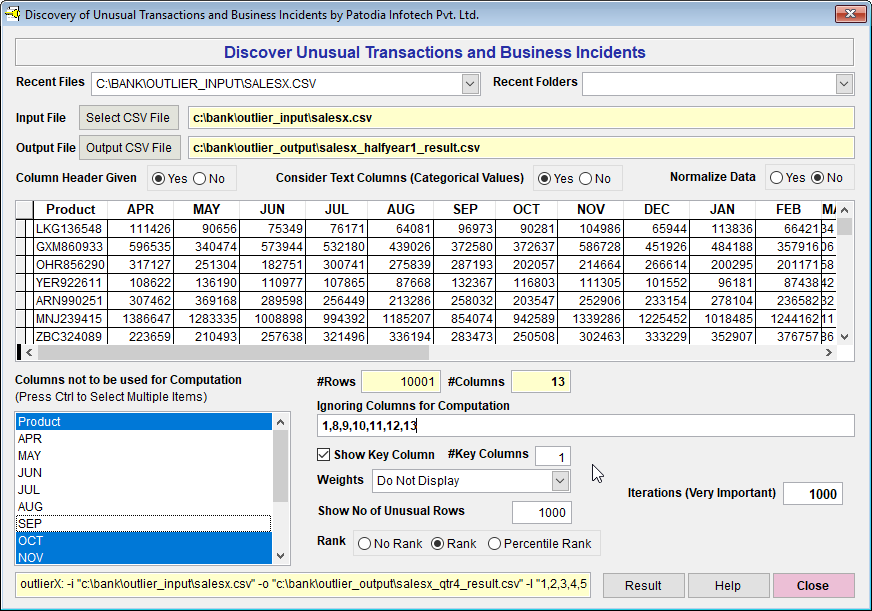
Result 6: First Half-Year Best Products
For this purpose, we have selected all columns except APR, MAY, JUN, JUL, AUG and SEP so that all other columns are ignored, and computation is done of these six months. This gives the best products result for First Half-Year (for the months of April, May, June, July, August and September). Below, we give the screenshot of "Discover":
When we click on "Result" button, we see the following result (given screenshot of Result):
Analysis of Result
The top Product ID is "DTS443028". Its score is 86.75%. The Key Column 1 is AUG. The sale of August month is 2,501,013 that is higher than other months of the First Half-Year. However, please note that the score is computed based on all the months of the First Half-Year (Months of April, May, June, July, August and September).
Result 7: Second Half-Year Best Products
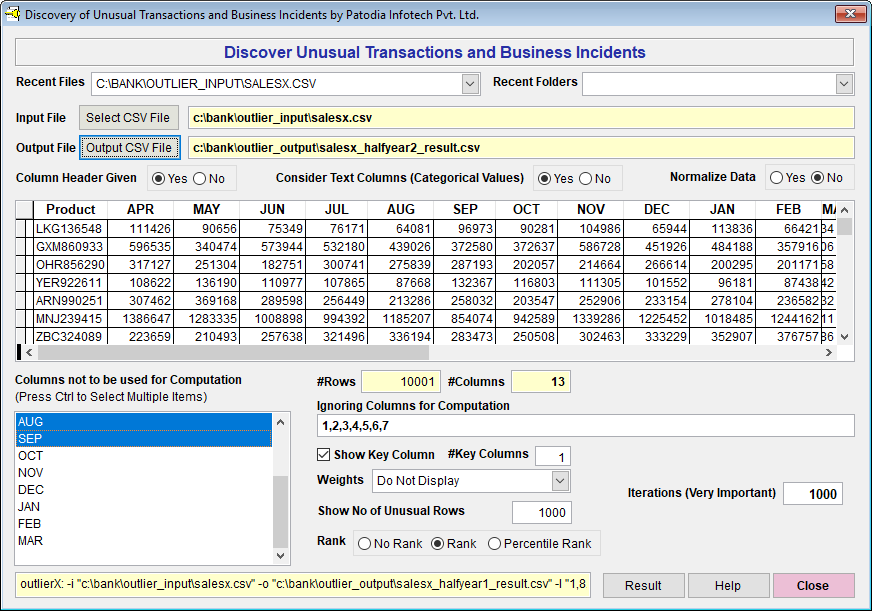
For this purpose, we have selected all columns except OCT, NOV, DEC, JAN, FEB and MAR so that all other columns are ignored, and computation is done of these six months. This gives the best products result for Second Half-Year (for the months of October, November, December, January, February and March). Below, we give the screenshot of "Discover":
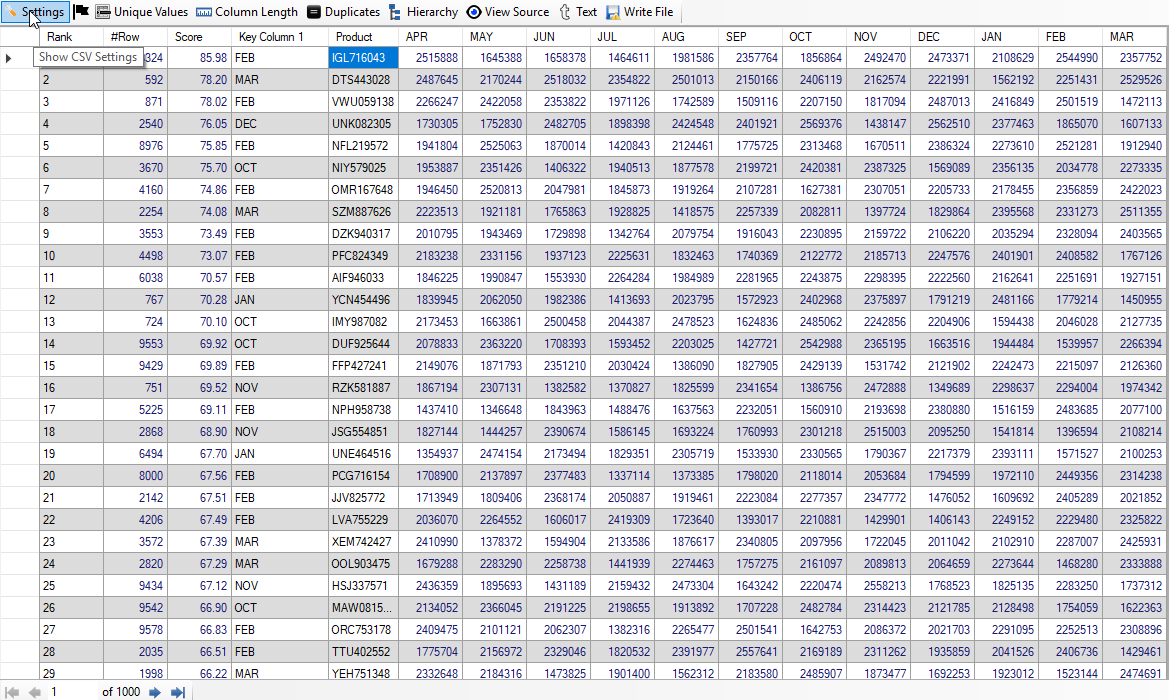
When we click on "Result" button, we see the following result (given screenshot of Result):
Analysis of Result
The top Product ID is "IGL716043". Its score is 85.98%. The Key Column 1 is FEB. The sale of the February month is 2,544,990 that is higher than other months of the Second Half-Year. However, please note that the score is computed based on all the months of the Second Half-Year (Months of October, November, December, January, February and March).
Note 1: The time taken for each type of result is less than 5 seconds on a moderate hardware.
Note 2: The basic idea to find best products is to concentrate on these products so that can improve total sales and improve the overall profitability.