For this case study, we have taken data from www.indiawaterportal.org:
Rainfall Data
As the data were given in Excel format, we have converted these to CSV. Conversion process is very simple. Just open the data in Excel and save as CSV.
The dataset consists of 55309 rows and 16 attributes. The data contains monthly rainfall from 1901 to 2002 for various states and districts. Below, we give list of attributes:
- State
- District
- Year
- Jan
- Feb
- Mar
- Apr
- May
- Jun
- Jul
- Aug
- Sep
- Oct
- Nov
- Dec
- vlookup
We have analysed yearly and quarterly rainfall data using "Discover".
Result 1: Yearly Data Analysis Result
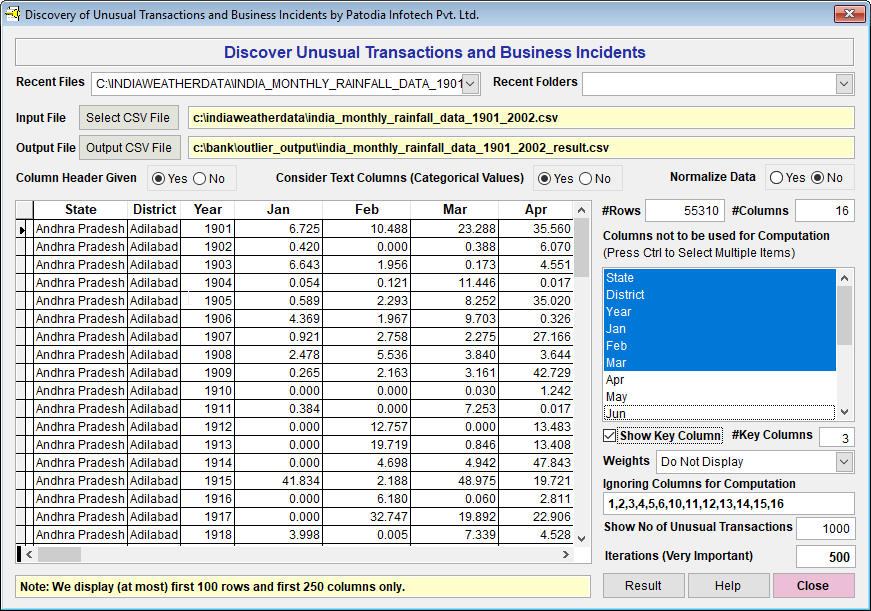
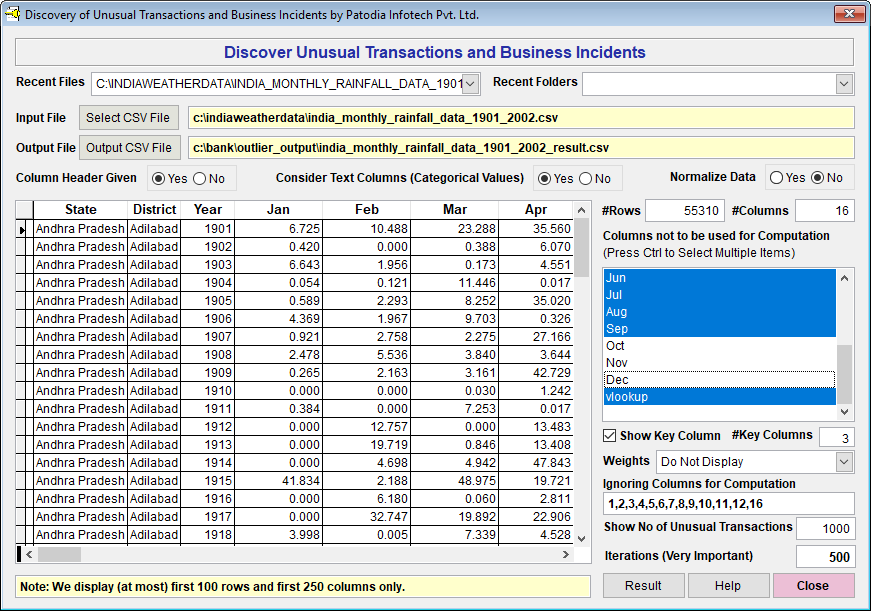
We have selected the dataset in "Discover" and asked to find out top 1000 rows. Please note that we have not done any feature engineering. Below, we give the screenshot of "Discover":
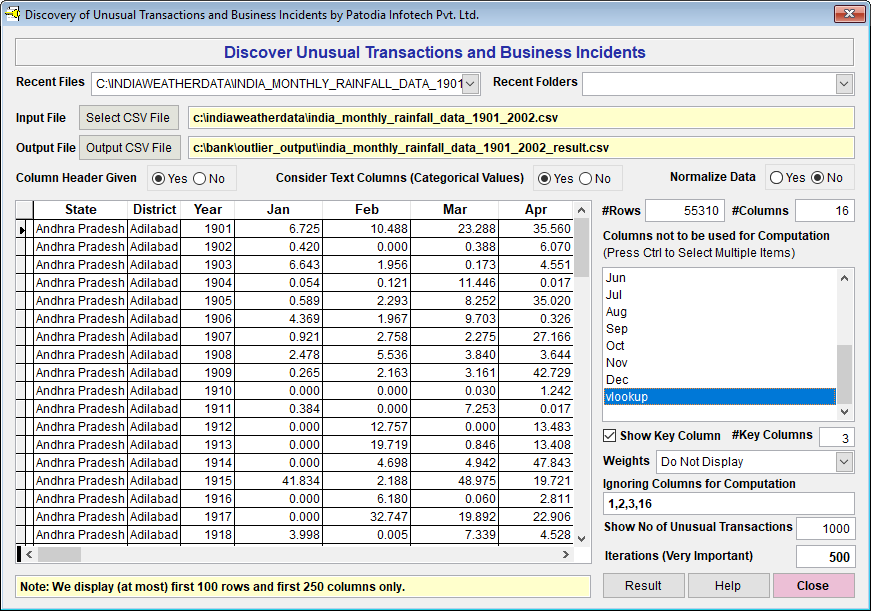
Please note that we have selected State, District, Year and vlookup so that computation is done on all twelve months' rainfall data.
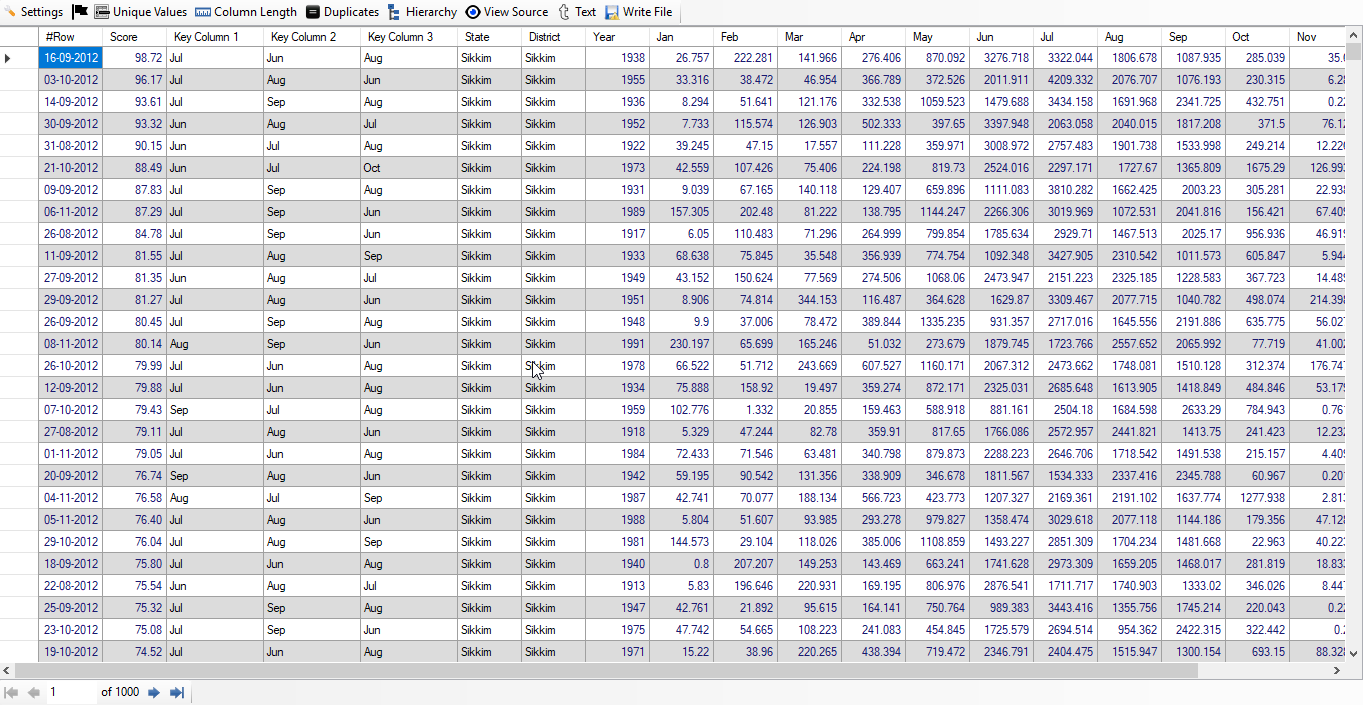
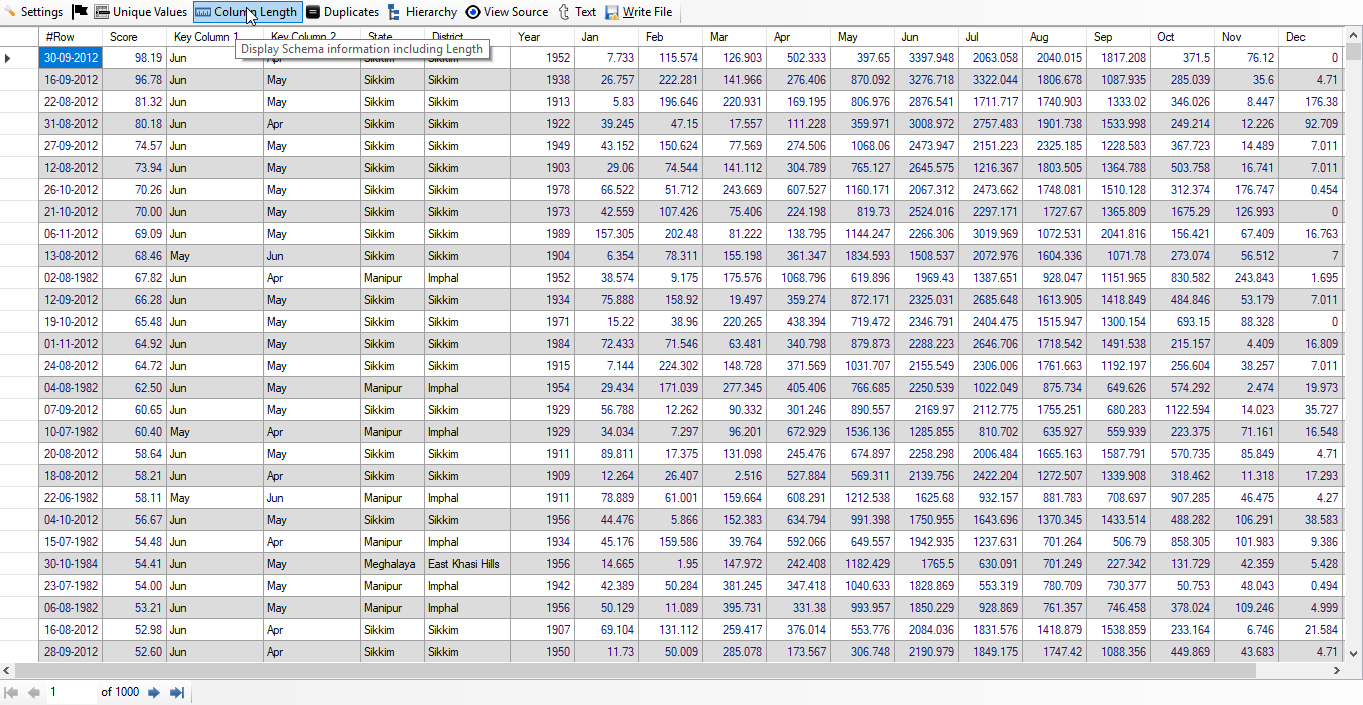
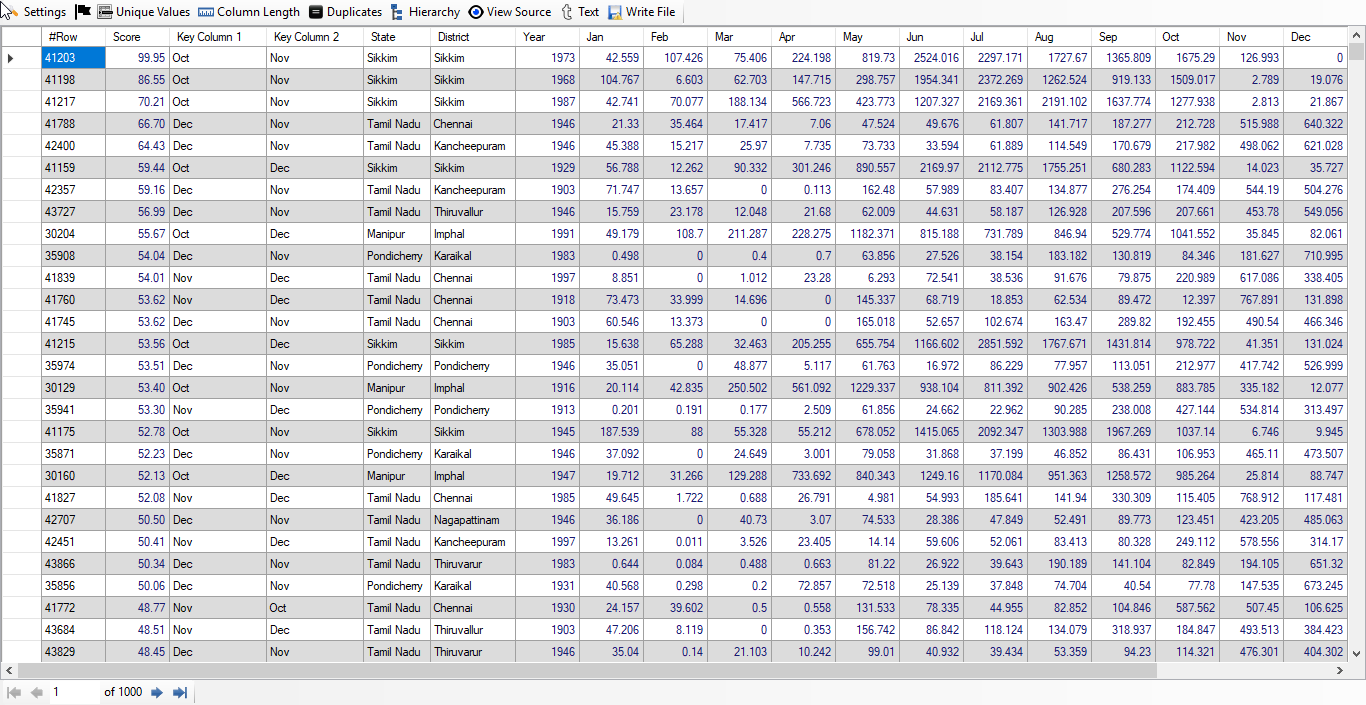
When we click on "Result" button, we see the following result (given screenshot of Result):
Analysis of Result
We see that as per result shown above, "Sikkim" state and "Sikkim" district appears on all rows we can see. Thus, Sikkim state had highest rainfall in India during 1901 and 2002. The years with highest rainfall are 1938, 1955, 1936, 1952 and 1922. From Key Column 1, we find that July has generally highest rainfall in "Sikkim" in most of the years.
Result 2: First Quarter Data Analysis Result
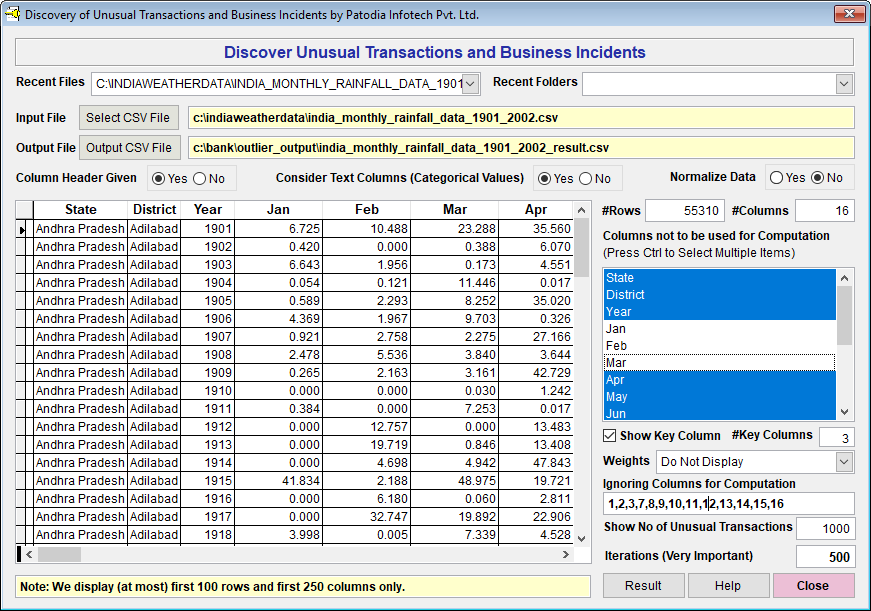
For this purpose, we have selected all columns except Jan, Feb and Mar. This gives the rainfall result for First Quarter. Below, we give the screenshot of "Discover":
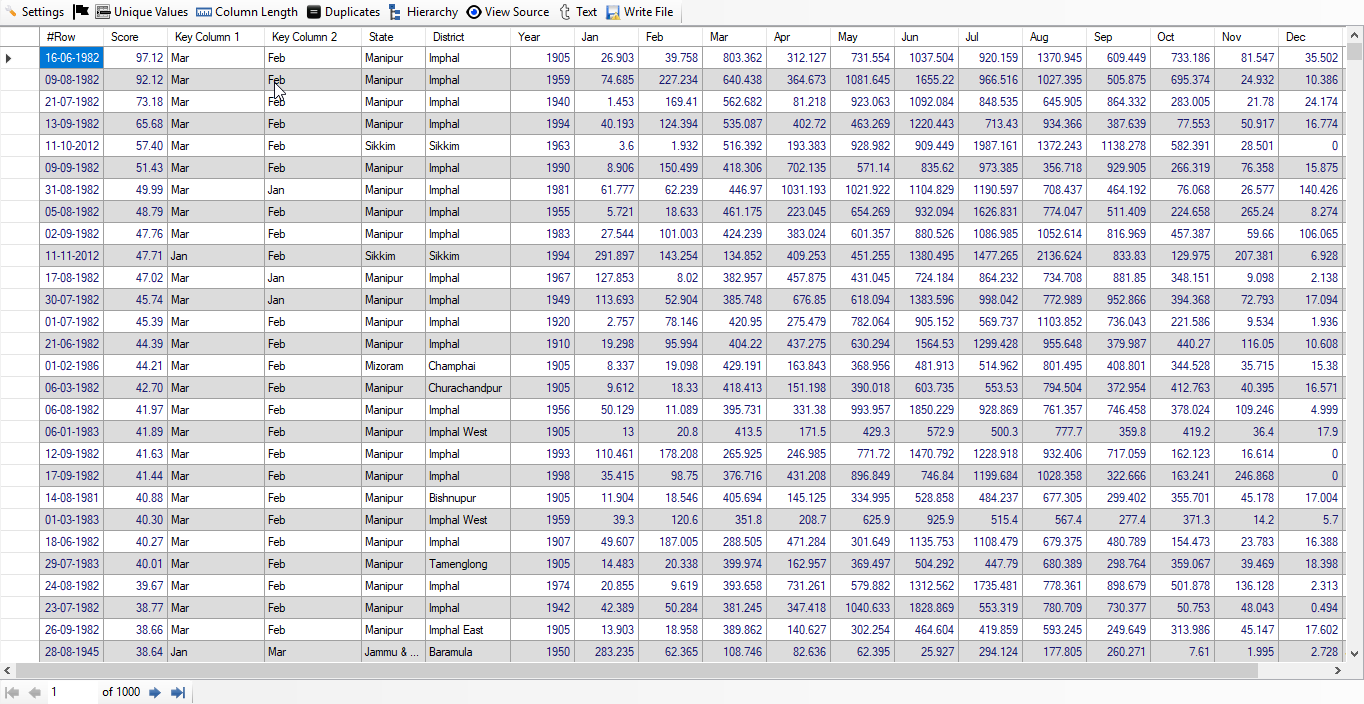
When we click on "Result" button, we see the following result (given screenshot of Result):
Analysis of Result
We see that as per result shown above, "Imphal" district of "Manipur" state is displayed on top. Most of the rows contains "Imphal" district, however, other districts also appear like "Sikkim", "Champhai" of "Mizoram" etc. If we study Key Column 1 and Key Column 2, we find that March has higher rainfall, then comes February and January has least rainfall in "Imphal" in the first quarter.
Result 3: Second Quarter Data Analysis Result
For this purpose, we have selected all columns except Apr, May and Jun. This gives the rainfall result for Second Quarter. Below, we give the screenshot of "Discover":
When we click on "Result" button, we see the following result (given screenshot of Result):
Analysis of Result
We see that as per result shown above, "Sikkim" is displayed on top. Most of the rows contains "Sikkim", however, other districts also appear like "Imphal" district of "Manipur" state and "East Khasi Hills" district of "Meghalaya" state etc. If we study Key Column 1 and Key Column 2, we find that June has highest rainfall in "Sikkim" in the second quarter.
Result 4: Third Quarter Data Analysis Result
For this purpose, we have selected all columns except Jul, Aug and Sep. This gives the rainfall result for Third Quarter. Below, we give the screenshot of "Discover":
When we click on "Result" button, we see the following result (given screenshot of Result):
Analysis of Result
We see that as per result shown above, "Sikkim" is displayed on top. "Sikkim" state and "Sikkim" district appears on all rows we can see. If we study Key Column 1 and Key Column 2, we find that July has highest rainfall in "Sikkim" in the third quarter.
Result 5: Fourth Quarter Data Analysis Result
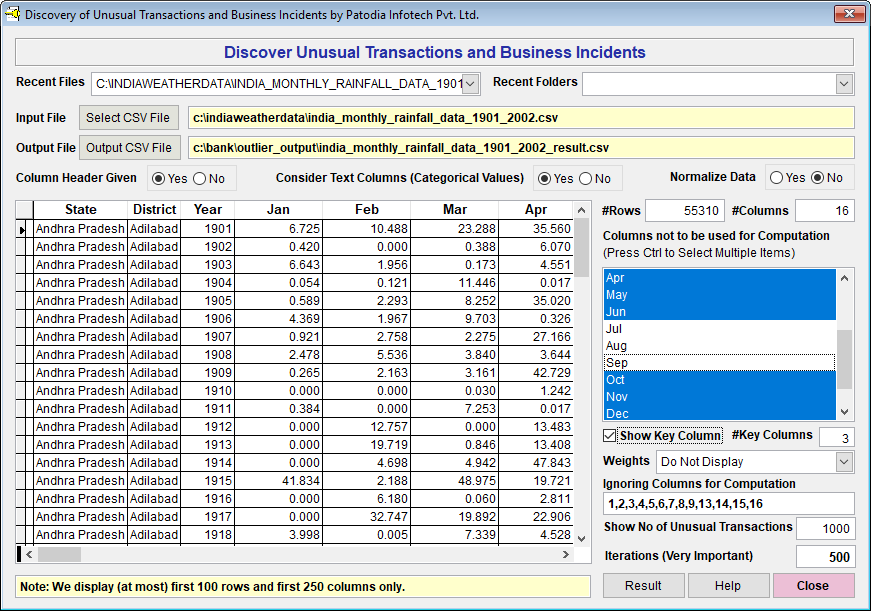
For this purpose, we have selected all columns except Oct, Nov and Dec. This gives the rainfall result for Fourth Quarter. Below, we give the screenshot of "Discover":
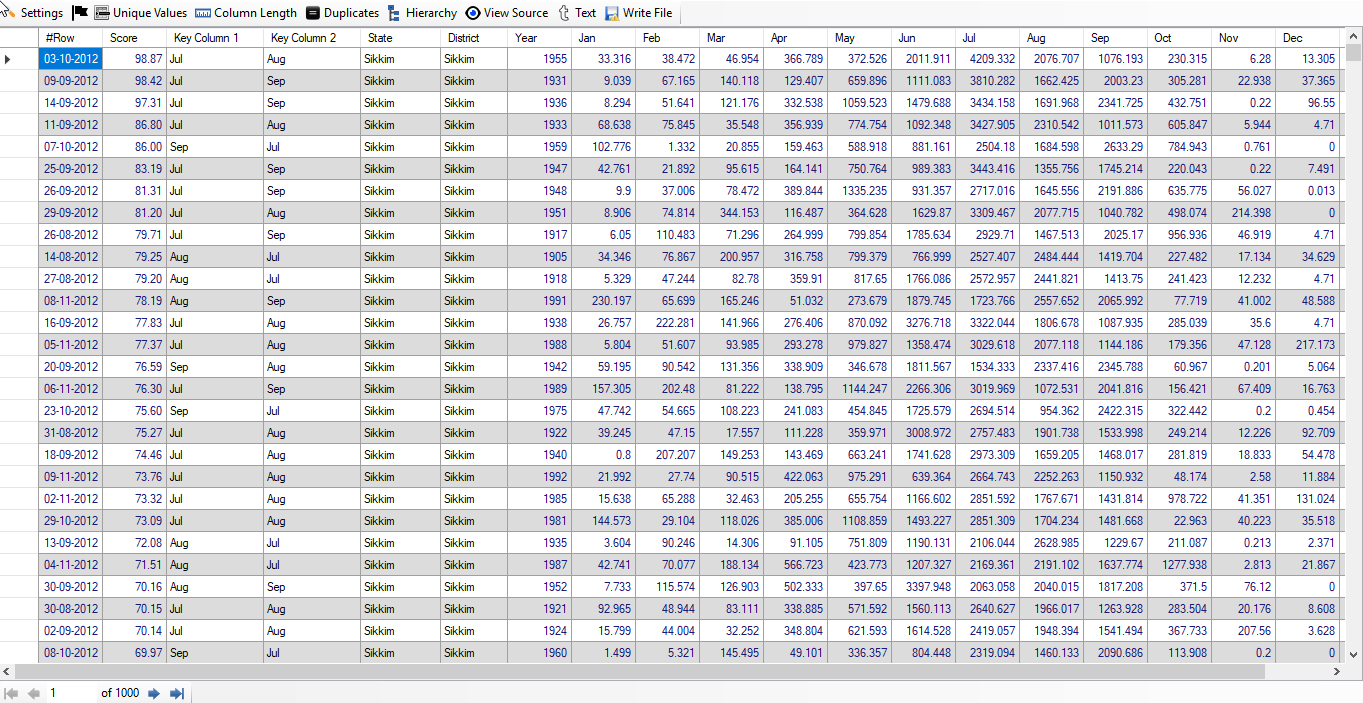
When we click on "Result" button, we see the following result (given screenshot of Result):
Analysis of Result
We see that as per result shown above, "Sikkim" is displayed on top 3. However, surprisingly, "Chennai" and " Kancheepuram" district of "Tamil Nadu" appear at 4th and 5th place respectively. As far as highest rainfall is concerned, October has highest rainfall in "Sikkim" whereas December has highest rainfall in "Tamil Nadu" in the Fourth quarter. If we study other rows, we find that "Tamil Nadu" appears more frequently, thus, we can conclude that generally "Tamil Nadu" has higher rainfall comparative to other states in the fourth quarter.
We find that October month has higher rainfall in "Sikkim" and "Manipur" whereas "Tamil Nadu" and "Pondicherry" have higher rainfall in the months of November and December.
Time Taken:
Even with 500 iterations, "Discover" has taken around 20 seconds to compute Yearly result and 5 seconds to compute quarterly result.