Dataset:
For this case study, we have taken data from Kaggle.com:
Countries Data
The dataset consists of 227 rows and 20 attributes. Below, we give list of attributes:
- Country *
- Region *
- Population *
- Area (sq. mi.) *
- Pop. Density (per sq. mi.)
- Coastline (coast/area ratio)
- Net migration
- Infant mortality (per 1000 births)
- GDP ($ per capita) *
- Literacy (%) *
- Phones (per 1000)
- Arable (%)
- Crops (%)
- Other (%)
- Climate
- Birthrate
- Deathrate
- Agriculture
- Industry
- Service
However, we have used the following attributes:
- Country
- Region
- Population
- Area (sq. mi.)
- GDP ($ per capita)
- Literacy (%)
Further, we have retained only those rows which had non-null values for all the above attributes. Thus, we have left with 209 rows.
Result: Countries Data Result
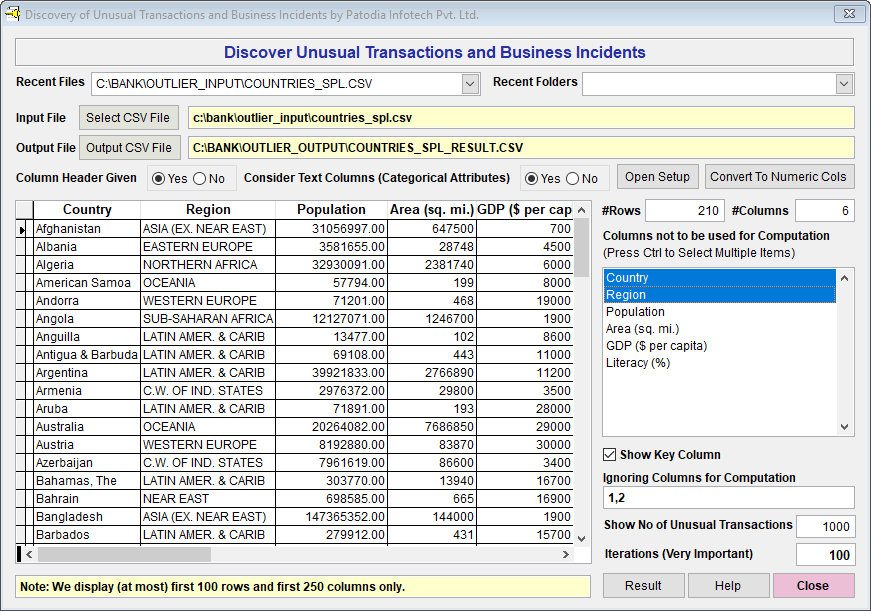
We have selected the dataset in "Discover" and asked to find out top 1000 Countries (as there are only 209, it listed all 209 countries). Please note that we have not done any feature engineering. Below, we give the screenshot of "Discover":

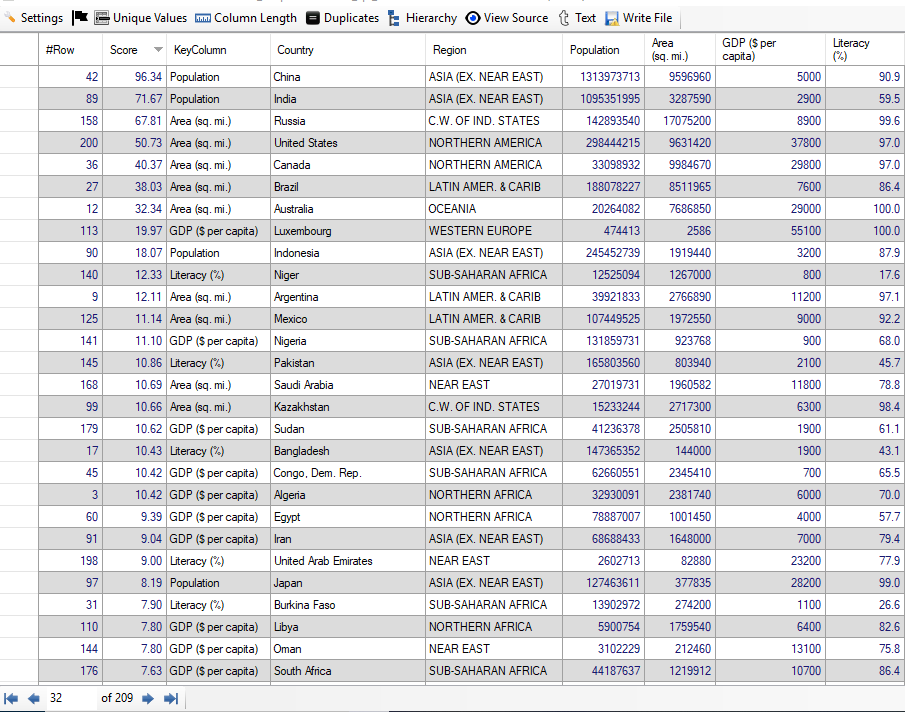
When we click on "Result" button, we see the following result (given screenshot of Result):

Analysis of Result
Let us analyse the result given by Discover. The top two countries are China and India and the key column for both the countries is "Population". It should be noted that these two countries have population above 1 billion whereas the third highest populated country "United States" has population of 298 million as per data given in our dataset.
The next four countries are Russia, United States, Canada and Brazil. The key column (Column that has highest impact, however anomaly is computed based on Population, Area, GDP and Literacy) is Area (sq. mi.). Russia has highest area. However, Canada has slightly bigger area than United States but placed lower. The reason is its population is much smaller than United states.
The next country Luxembourg and key column is GDP ($ per capita). The country has GDP of 55,100 that is highest among all countries listed in the given data.
We have analysed countries with high Population, Area and GDP. Now, let us take the case of Literacy. We find that it has listed first country with least Literacy is Niger that has literacy rate of 17.6%. The next country listed with low literacy rate is Pakistan. It has 45.7% literacy which is not among lowest. However, it has been listed probably because it has comparatively higher GDP and high population. Please also note that it has put countries in the top based on High Population, High Area and High GDP whereas it has put countries on top with low literacy on its own (without any additional input or feature engineering).


