Dataset:
For this case study, we have taken data of Prudential Life Insurance from Kaggle.com:
Dataset. The data set consists of 59,381 life insurance applicants (number of rows) with 128 attributes (number of columns) which describe the characteristics of life insurance applicants. The data set comprises of categorical, continuous as well as discrete variables, which are anonymized. The "ID" is Categorical Variable - Unique identifier for each applicant. The result is "Response" (last column) representing 8 levels of risks.
As data are anonymized, we don’t know the actual meaning of most of the data. The brief details of the dataset is given below:
- ID: Categorical Variable - Unique identifier for each applicant
- Product_Info_1-7: Seven normalized attributes concerning the product applied for. Product_Info_4 is continuous, rest are categorical.
- Ins_Age: Continuous - Normalized age of an applicant
- Ht: Continuous - Normalized height of an applicant
- Wt: Continuous - Normalized weight of an applicant
- BMI Continuous - Normalized Body Mass Index of an applicant
- Employment_Info_1-6: Six normalized attributes concerning employment history of an applicant. Employment_Info 2, 3 and 5 are categorical whereas Employment_Info 1, 4 and 6 are continuous.
- InsuredInfo_1-7: Seven normalized attributes offering information about an applicant. All the variables are categorical.
- Insurance_History_1-9: Nine normalized attributes relating to the insurance history of an applicant. All the variable except Insurance_History_5 are categorical whereas Insurance_History_5 is continuous.
- Family_Hist_1-5: Five normalized attributes related to an applicant's family history. Except Family_Hist_1, all the variables are continuous whereas Family_Hist_1 is categorical.
- Medical_History_1-41: There are 41 normalized variables providing information on an applicant’s medical history. All the variables are categorical.
- Medical_Keyword_1-48: There are 48 dummy variables relating to the presence or absence of a medical keyword associated with the application
- Response Categorical Target variable, which is an ordinal measure of risk level, having 8 levels. We are assuming that Response 1 and 2 are high-risk applicants.
Result:
Without doing any feature engineering, we have processed 126 attributes (except ID and Response) for 59,381 applicants. We have asked "Discover 2.0" to show top 1,000 applicants. In the 1,000 applicants, we got around
600 applicants with Level 1 and Level 2 (High-Risk) resulting into accuracy of around 60%. It took around 45 seconds to process 59,381 rows and 126 columns (Total data 7.48 million data) on a moderate hardware (7th Generation i-5 Laptop with 8 GB Memory).
In the next step, we have done little feature engineering with the help of a domain expert. We have computed Age_BMI based on the normalized age and normalized BMI.
When we have taken just these 3 attributes namely Age, BMI and Age_BMI. In top 1,000 applicants, we got around 820 applicants with high risk. This means, we have achieved accuracy of 82% just by using three attributes.
We have used only two features "Age" and "Age_BMI" and asked our product "Discover 2.0" to find top 1000 high-risk customers. This time we got around 840 applicants with high risk from top 1,000 applicants.
So, we have achieved 84% accuracy. If we consider top 100 applicants, we get accuracy between 94% and 96%. For top 500 applicants, accuracy is around 90% and top 200 applicants, accuracy achieved is around 92%.
Note: As the product works based on random numbers, the result may slightly differ from one experiment to another experiment.
Can we achieve accuracy of 95% and above?
We have achieved around 84% accuracy by using "Discover 2.0" from top 1,000 applicants. Please note that we have used only two attributes "Age" and "Age_BMI" (Age_BMI is computed from Age and BMI). If we are provided the following additional attributes, probably, we can achieve accuracy of around 95% (even higher):
(1) Gender: In most countries men have higher mortality rate.
(2) Smoker / Non-smoker: Smokers have higher mortality rate.
(3) Hypertension: Yes / No. Person with hypertension has higher mortality rate.
(4) Diabetic: Yes / No. Diabetic person has higher mortality rate.
(5) Suffering from any Serious Disease - Yes / No
Probably most of the above details are given in the dataset but hidden behind anonymous variables. So, we are not able to use these.
Screenshots:
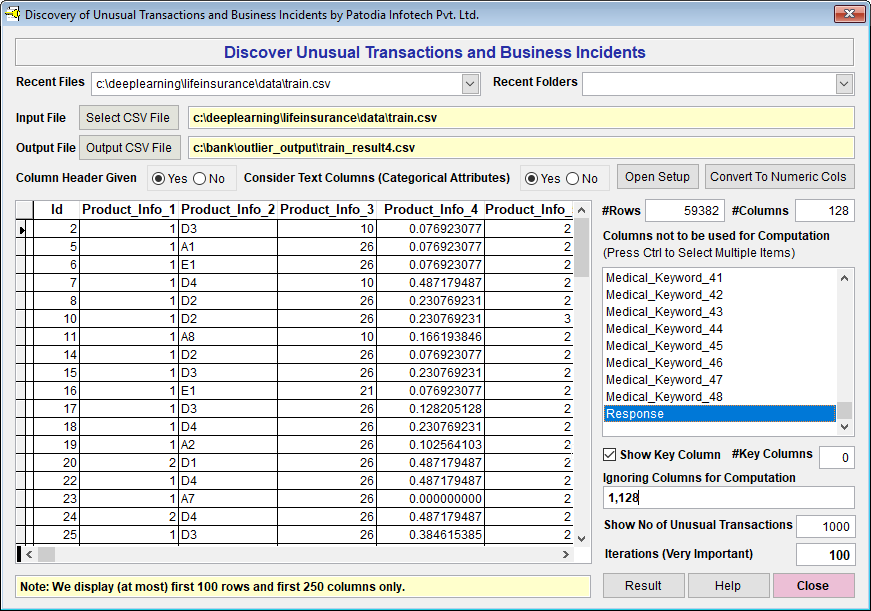
Below, we show screen of wherein the discover is ready to process 126 attributes to get top 1000 high-risk applicants:
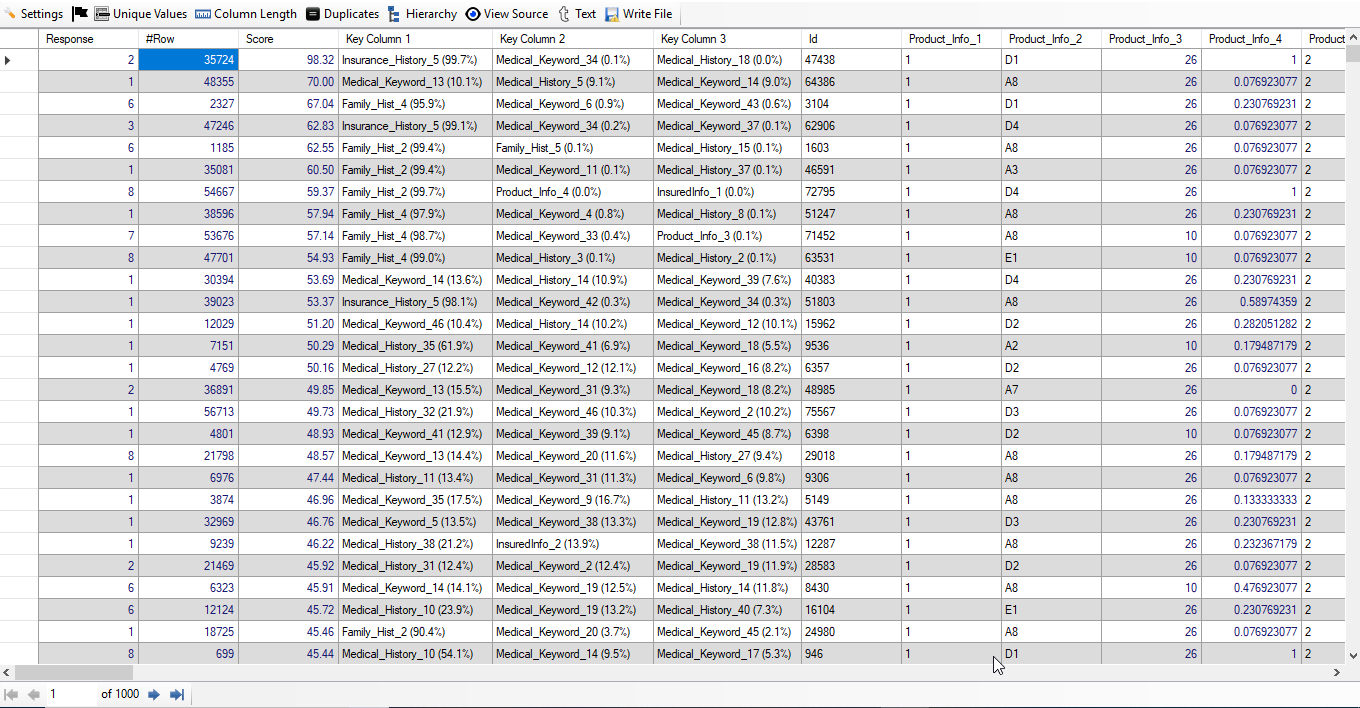
Below, the screenshot of the result is shown:
Below, the screenshot of the result with Number of Response:
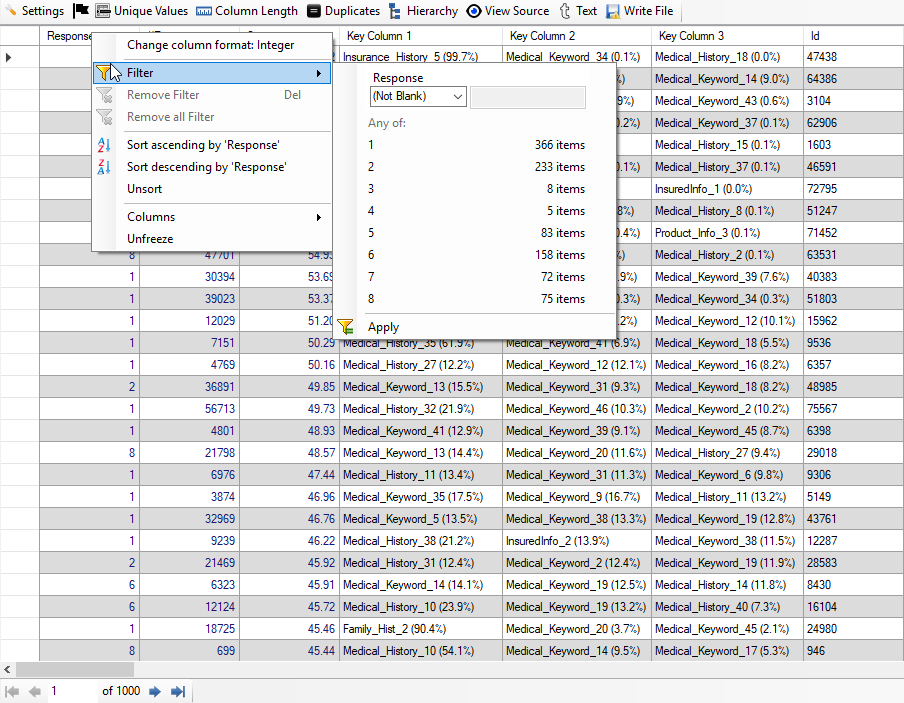
If you see the result carefully, you will observe that out of top 1000 high-risk applicants, there are 366 applicants with Response 1 and 233 applicants with Response 2. So, we have got 599 applicants which are really high-risk applicants. Thus, we have achieved around 60% accuracy without any feature engineering. We are also able to see the Key Column 1, Key Column 2 and Key Column 3 (Top 3 features for each applicant) with percentage computed and shown automatically.
Below, the screenshot of Top 1000 high-risk applicants is shown wherein we have used two attributes - Age and Age_BMI:
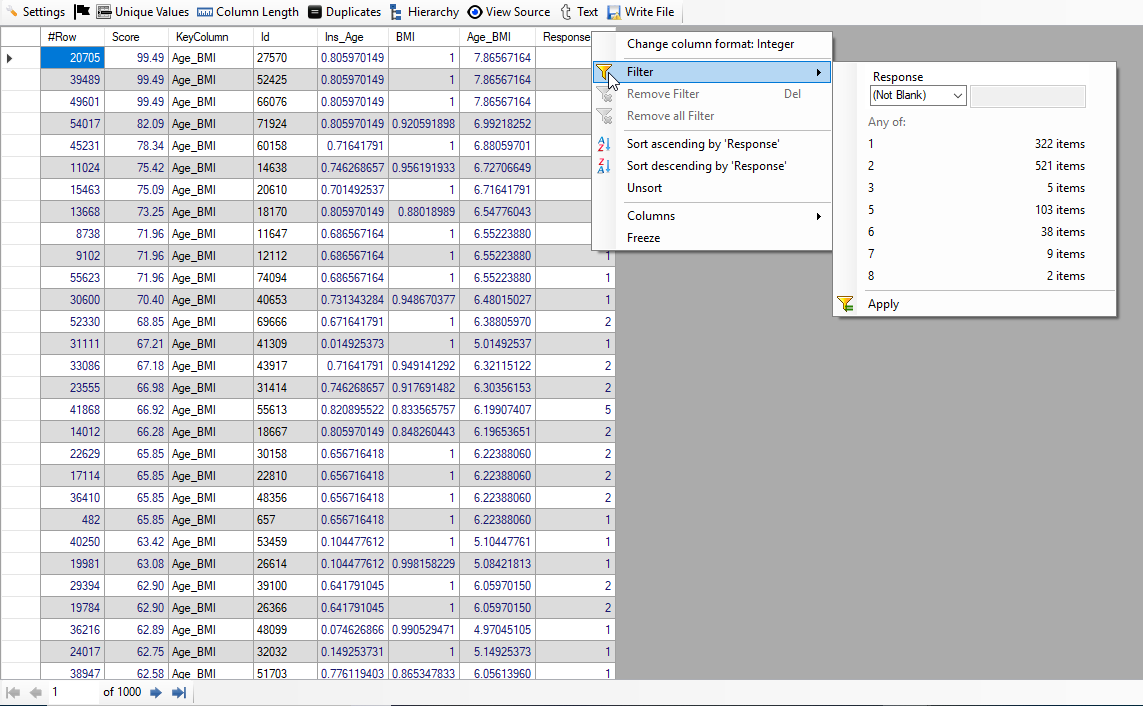
In the above image, we see that there are 322 applicants with Response 1 and 521 applicants with Response 2. Thus, we have got 843 applicants classified correctly. So, we have achieved accuracy of around 84%.
Below, the screenshot of Top 100 (One Hundred) high-risk applicants is shown wherein we have used two attributes - Age and Age_BMI:
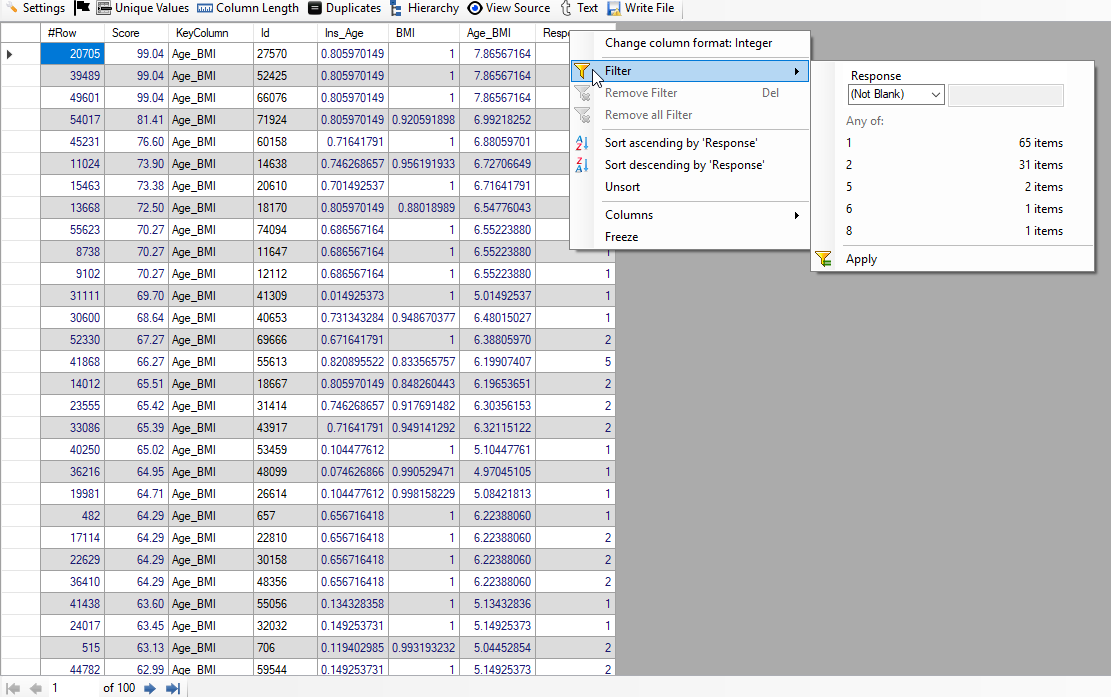
In the above image, we see that there are 65 applicants with Response 1 and 31 applicants with Response 2. Thus, we have got 96 applicants classified correctly. So, we have achieved accuracy of around 96%.