Dataset:
For this case study, we have taken data from UCI Machine Learning Repository:
Chronic Kidney Disease Data
The dataset consists of 400 rows and 25 columns. The details of columns are given below:
(1) age years
(2) blood pressure
(3) specific gravity
(4) albumin
(5) sugar
(6) red blood cells
(7) pus cell
(8) pus cell clumps
(9) bacteria
(10) blood glucose random
(11) blood urea
(12) serum creatinine
(13) sodium
(14) potassium
(15) hemoglobin
(16) packed cell volume
(17) white blood cell count
(18) red blood cell count
(19) hypertension
(20) diabetes mellitus
(21) coronary artery disease
(22) appetite
(23) pedal edema
(24) anemia
(25) class
The last column with the name 'class' can take value "ckd" or "notckd". Value "ckd" means the person is suffering from Chronic Kidney Disease, otherwise not.
Result: Top 100 Result
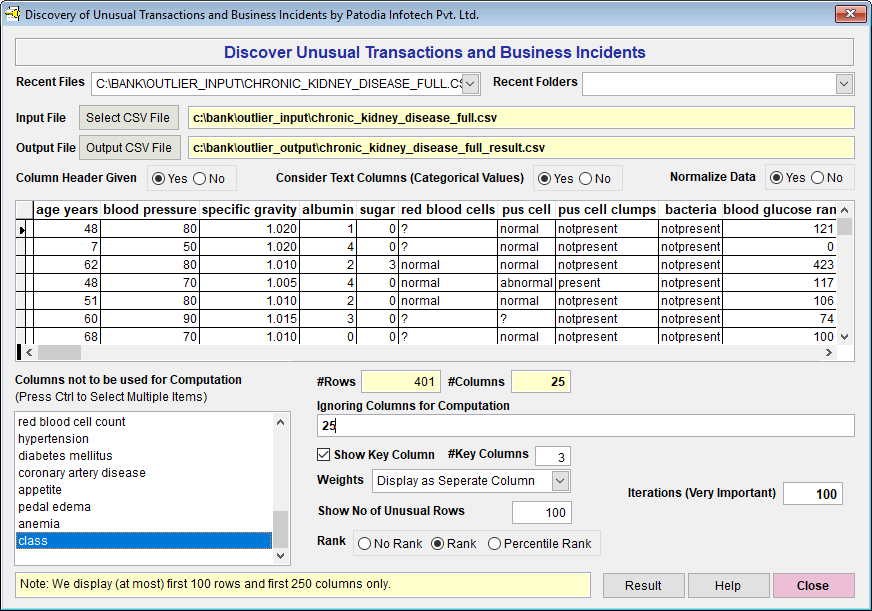
We have selected the dataset in "Discover" and asked to find out top 100 result. Below, we give the screenshot of "Discover":
When we click on "Result" button, we see the following result (given screenshot of Result):
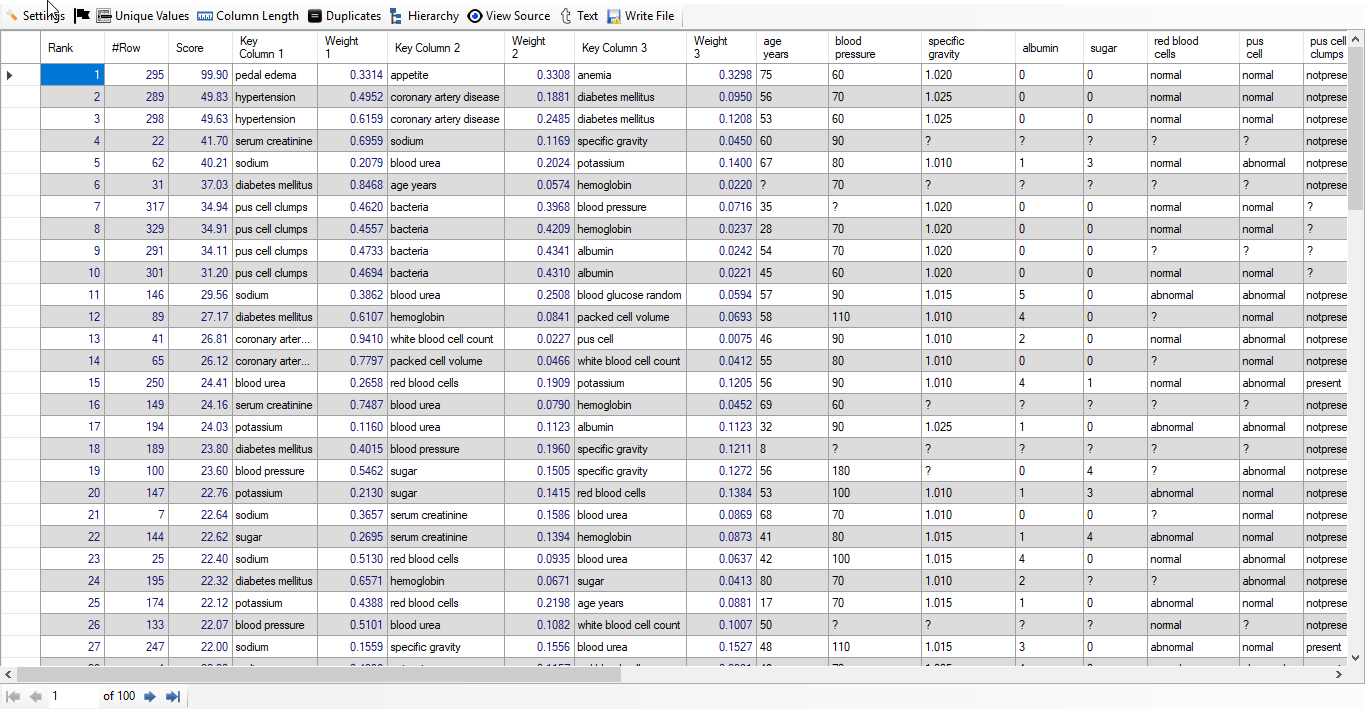
We find that out of 100 top rows, 93 rows are of people suffering from Chronic Kidney Disease. This means we have achieved accuracy of 93% without any feature engineering using "Discover". Below, we give screenshot of the result:
Result 2: Top 100 Result
We got first result wherein we got 93% accuracy. To achieve, better result, we have done auto feature engineering facility provided by "Discover" and got the following result.
Below, we give feature and its value found by "Discover":
sugar = 8.2604
sodium = 5.8276
potassium = 5.1497
blood glucose random = 4.8403
blood urea = 4.6178
diabetes mellitus = 3.4302
white blood cell count = 3.4257
blood pressure = 3.3091
serum creatinine = 2.9414
age years = 2.6859
albumin = 2.3649
red blood cells = 2.2366
coronary artery disease = 1.2751
packed cell volume = 1.2171
pus cell = 0.9568
red blood cell count = 0.889
bacteria = 0.4214
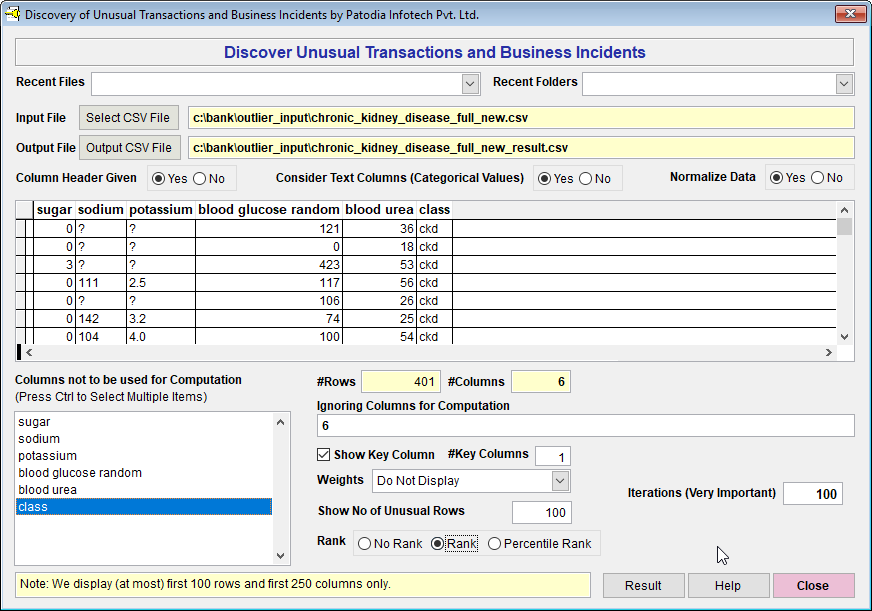
We have taken top 5 features and created a new dataset with the features "sugar", "sodium", "potassium", "blood glucose random", "blood urea" and "class". We have ignored rest of the columns because the values of these columns were small.
We have selected the dataset in "Discover" and asked to find out top 100 result. Please note that we have not taken into account the columns 'class'. Below, we give the screenshot of "Discover":
When we click on "Result" button, we see the following result (given screenshot of Result):
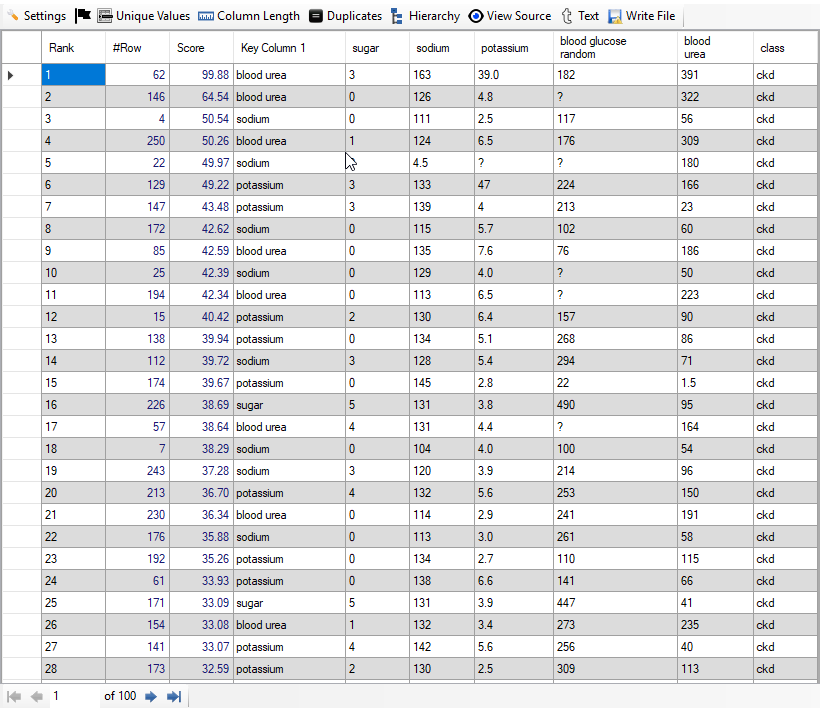
We find that out of 100 top rows, 99 are really patients. Thus, we have achieved accuracy of 99% from top 100 anomalies. It has been achieved using just 5 columns and auto feature engineering facility provided by "Discover". Below, we give screenshot of the result:
 Non-Patienst
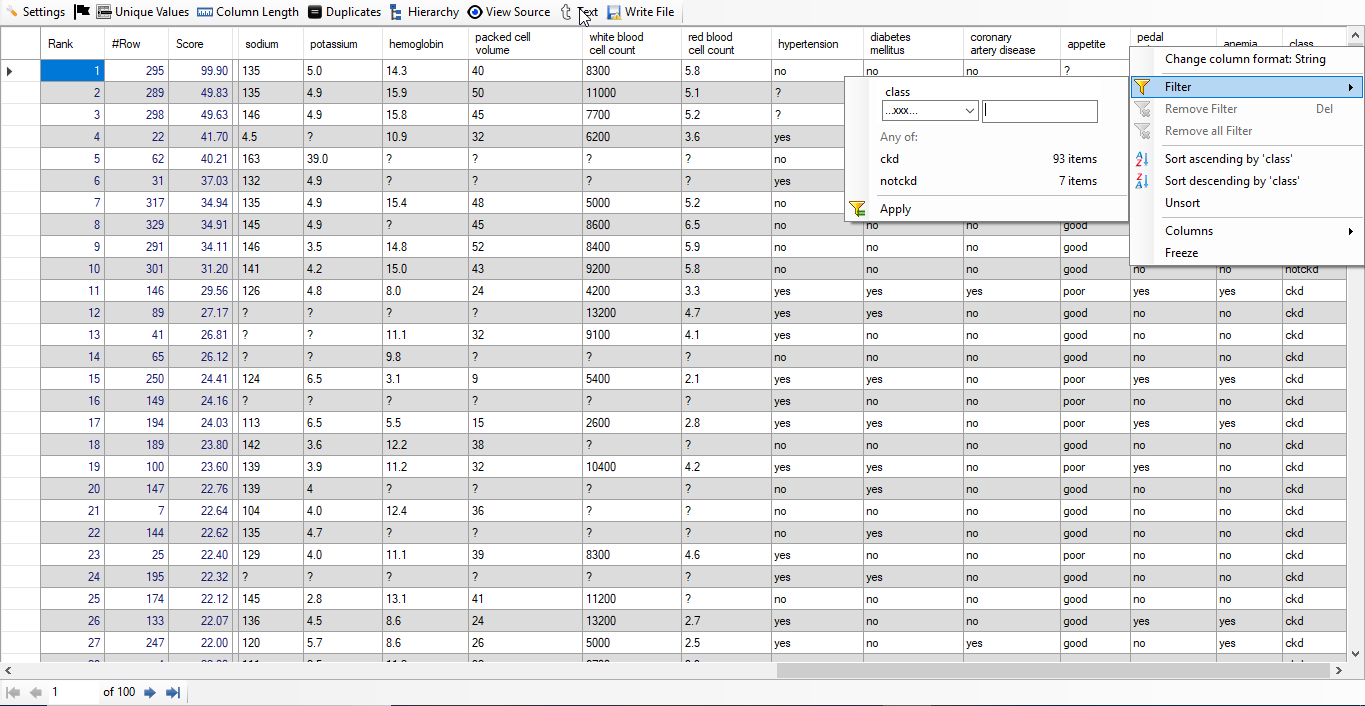
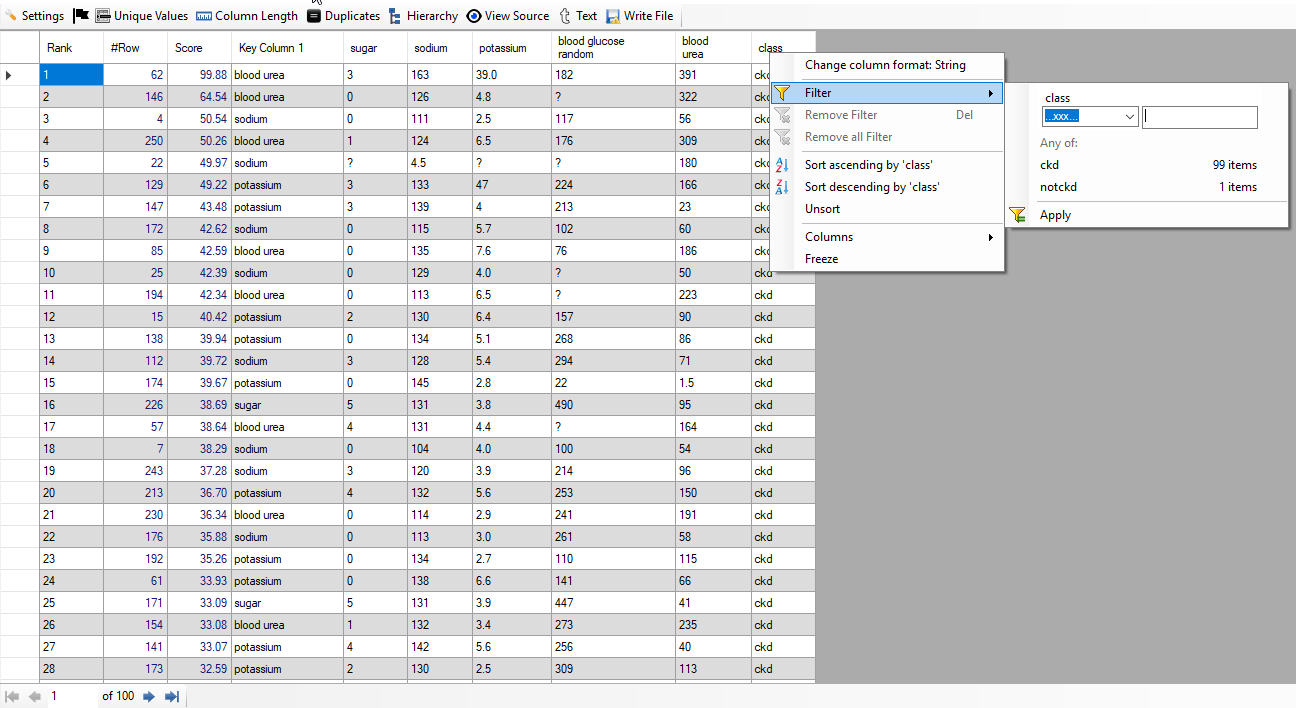
: We have filtered all non-patients by putting class equal to "notckd". Below, we give screenshot of the result:
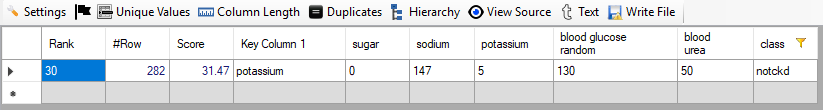
We see that the rank of the only non-patient is 30.
Time Taken: It hardly takes 1 second to get list of top 100 result as the total number of rows were 400 only.
Can we detect patients from any type of data??
Please note that "Discover" is not meant to find patient from medical data. It just finds anomaly from the given data. As patients are not normal, "Discover" is able to detect patients with high accuracy. However, let us make it very clear that its job is not to find patients from medical data, its job is to find anomalies from any given data.